

01 / Geocentrum: from an address to the right map location
Packeta needs coordinates for delivery addresses so that downstream logistics systems can use them. Addresses arrive from different shops, forms and bulk shipment submissions, sometimes with typos, abbreviations or fields in an unexpected order.
We developed Geocentrum: a service for storing, searching, validating and geocoding addresses. It gives internal applications shared address logic through an API.
The challenge: understand addresses from real operations
The task is to turn inconsistent address text into structured components and find the corresponding location. Czech data comes from RÚIAN, with national sources for other countries. Search needs to handle exact matches and selected differences, while supporting additional coordinate providers.
How the solution works
Libpostal helps identify components such as city, street, house number and postcode. The Go application normalises data and evaluates search results according to component matches, using synonyms and tolerance for selected typos.
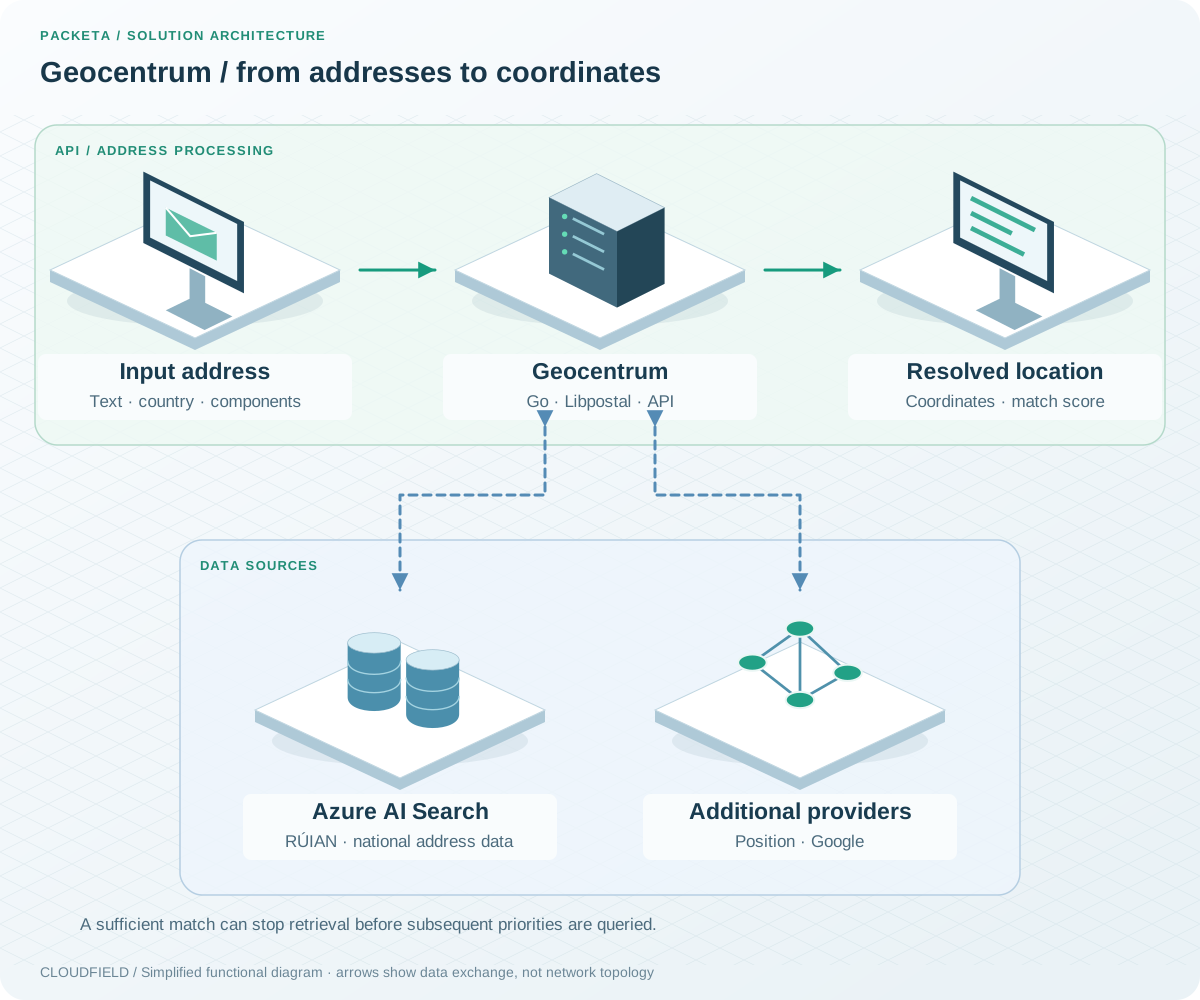
Geocentrum has its own process for handling addresses. Providers are queried according to country configuration and priority; every provider is not automatically called for every request.
Providers at the same priority can run concurrently. Once a result meets the required score, subsequent levels need not be called. The score describes address-component similarity, rather than guaranteeing parcel delivery.
For example, an abbreviated street name does not need to arrive in a perfectly standardised form. Geocentrum compares it with address records and returns a matching location. The same foundation supports suggestions and reverse geocoding: finding nearby addresses from a map point.
Technologies and our role
| Area | Technologies | What we deliver |
|---|---|---|
| Address logic | Go, Libpostal, Azure AI Search | Normalisation, retrieval and geocoding |
| Integration | API, address sources, coordinate providers | A shared service for internal applications |
| Operations | AKS, GitLab, Argo CD, Grafana, Loki, Azure Monitor | Deployment, configuration and monitoring |
What Geocentrum delivers
Packeta has one address service for multiple applications. Address data follows a consistent processing workflow connected to coordinates. Development includes validation against Czech and Slovak address datasets, with containerised operation in Azure Kubernetes Service.
02 / Automated parcel measurement: dimensions, weight and identity
During warehouse processing, each parcel’s dimensions and weight need to be measured to verify the shipping price. Manual measurement and data entry add work and create opportunities for errors.
For Packeta, we delivered automated parcel measurement using computer vision, integrated with industrial scales and internal systems.
The challenge: collect parcel data in one workflow
The measurement workstation needs to detect the parcel, determine its dimensions, read its code and associate its weight. Results must remain linked to the individual parcel for downstream warehouse and business systems.
How the solution works
Computer vision detects parcel boundaries and reads 1D and 2D codes. Stereoscopic and depth cameras supply the information for contactless dimension measurement. Integration with an industrial scale adds weight.
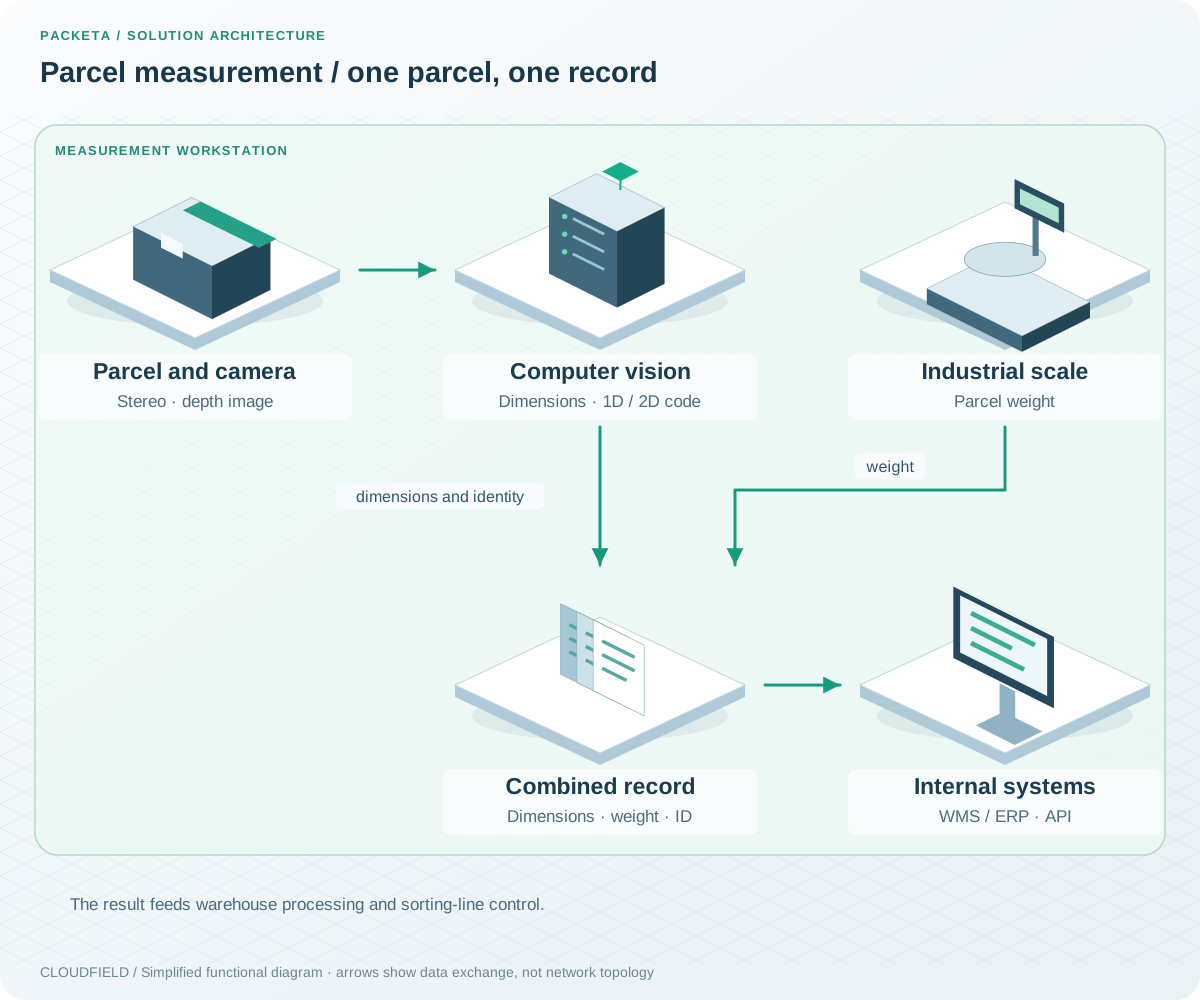
Parcel measurement is a separate process. Camera measurements and weighing are combined in a record for the individual parcel.
The result is one record containing dimensions, weight and parcel identity. Data passes to internal WMS/ERP systems and connects to sorting-line control. A parcel moving through the workstation, for example, gains the data needed for subsequent warehouse processing without entering each dimension separately.
Technologies and our role
| Area | Technologies | What we deliver |
|---|---|---|
| Detection and measurement | Computer vision, CNNs, stereoscopic and depth cameras | Parcel boundaries and dimensions |
| Identification and weight | 1D/2D code reading, industrial scales | Measurements associated with the correct parcel |
| Integration | Internal APIs, WMS/ERP | Record handoff and sorting-line integration |
What automated measurement delivers
Operators no longer need to enter every dimension manually. Packeta gains consistent data for downstream processing and transportation billing. Measurement is part of parcel processing and provides the data needed to verify the shipping price.
03 / Distribution-network planning: evaluate changes before implementation
Developing a distribution network involves decisions about depots, routes, courier lines and shifts. A change in one place can affect capacity and delivery time elsewhere. Testing every alternative in live operations is impractical.
We created a planning tool with distribution-network simulation so that Packeta can compare development scenarios and their effects.
The challenge: compare options within known constraints
Planners need to assess network throughput, capacity constraints and projected delivery times. The tool supports evaluating a new depot, changed routes or adjusted shifts before a decision is implemented.
How the solution works
The simulation represents depots, transit routes and courier lines. Optimisation algorithms evaluate parameter combinations subject to capacity constraints. Outputs support comparison between alternatives and identification of overloaded locations.
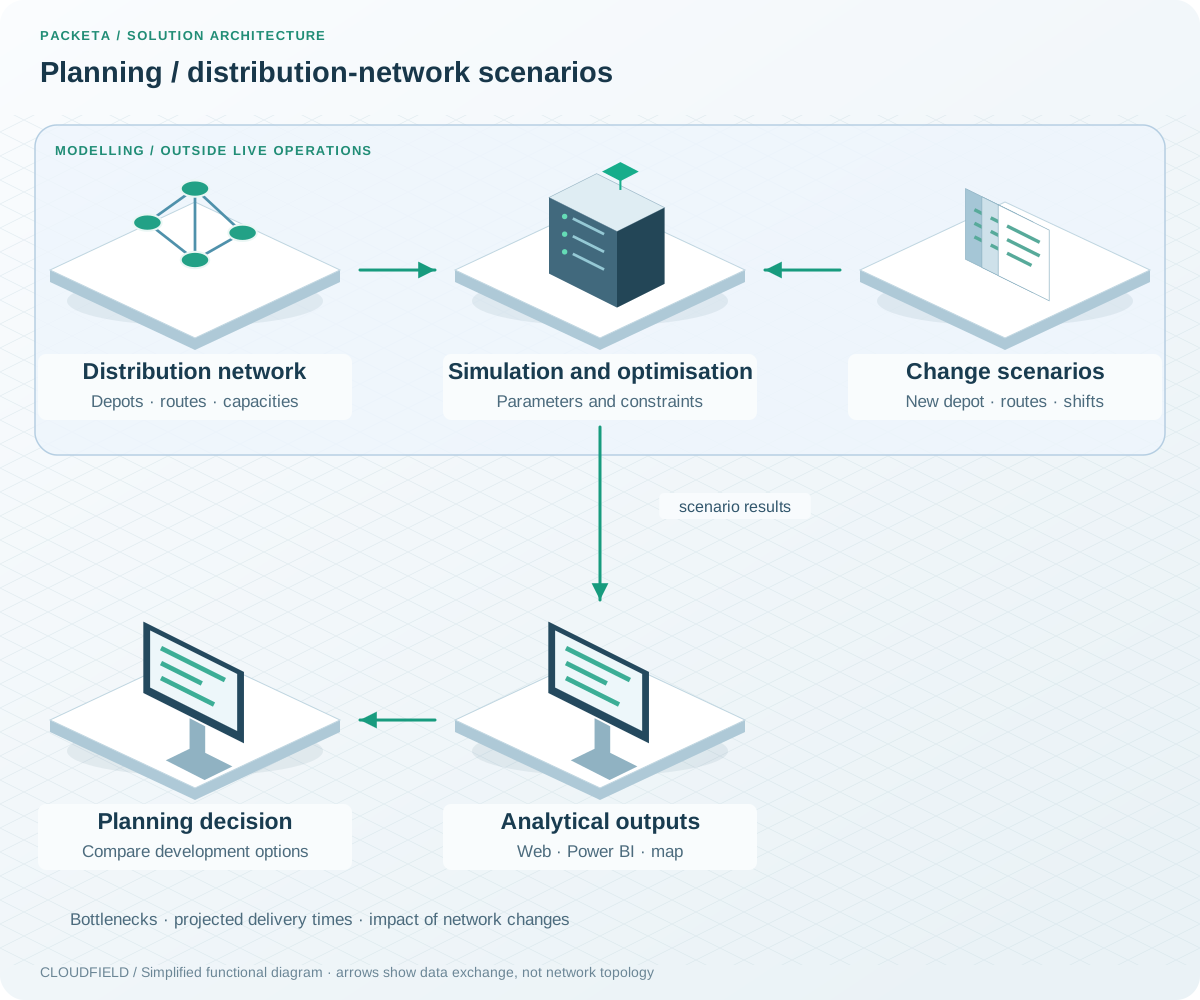
A separate analytical process for network planning. Results are modelled scenarios, rather than interventions in live operations.
Analytics in a web application and Power BI show bottlenecks, projected delivery times and scenario impacts. An interactive map adds geographic context, while exports support internal reporting.
When considering a new depot, for example, the team can compare the existing network with a scenario that moves some parcels onto new routes. Decisions can then be assessed in the context of the whole network.
Technologies and our role
| Area | Technologies | What we deliver |
|---|---|---|
| Network modelling | Distribution-process simulation | Depots, routes, courier lines and constraints |
| Scenario comparison | Optimisation algorithms | Evaluation of operating parameter combinations |
| Results | Web application, interactive map, Power BI | Dashboards, scenarios and reporting outputs |
What the planning tool delivers
Planners can evaluate development options and identify capacity issues before introducing changes. Distribution-network decisions are supported by comparisons of modelled scenarios.
“Thanks to Cloudfield, we successfully migrated our IT systems and infrastructure to the public cloud, allowing us to handle peak periods and improve the security and efficiency of our solutions. This was a significant step in improving our services and opened up new opportunities for development and innovation in e-commerce logistics.”
— Adam Horzenberger, CTO, Packeta Group